Vertical Orientation System (VOS) Project Flight Results
This graph shows the polar angle from vertical (tilt) in the ground frame of reference, for flight 8 of VTS-1 on 5/17/24, without pitch or yaw control. It shows the typical response for a rocket that, in this case, rotates 15 deg into the wind as it leaves the launch guide. The wind speed at ground level was around 10 mph.
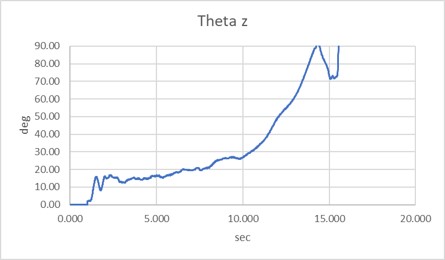
This graph shows the polar angle from vertical (tilt) for flight 13 of VTS-1 on 11/16/24 with pitch and yaw control with a wind speed of around 15 mph. There is a slight rotation as the rocket leaves the launch guide, but the pitch and yaw control systems quickly correct the tilt and keep it within 2 degrees of vertical until the velocity of the rocket is too low for the canards to be effective
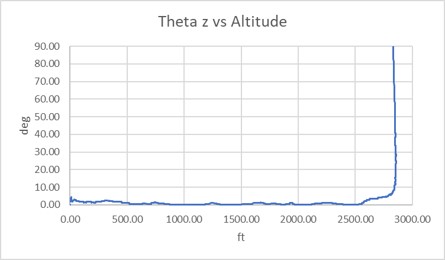
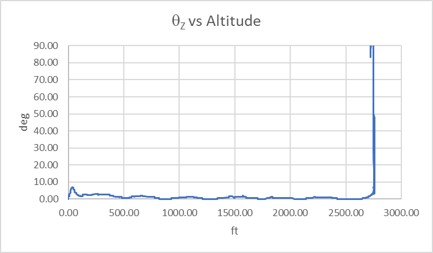
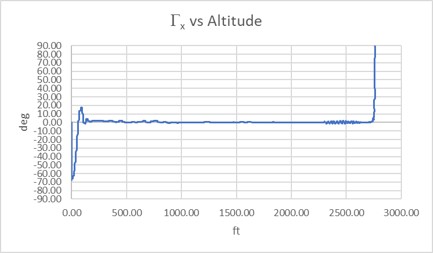
It is even more impressive to plot the tilt angle versus the altitude of the rocket. Since the rocket slows as it approaches apogee, it spends a large portion of the flight time in the last few feet of the upward flight. This can bee seen in this graph as the rocket maintains a near vertical trajectory until it finally arcs over at apogee.
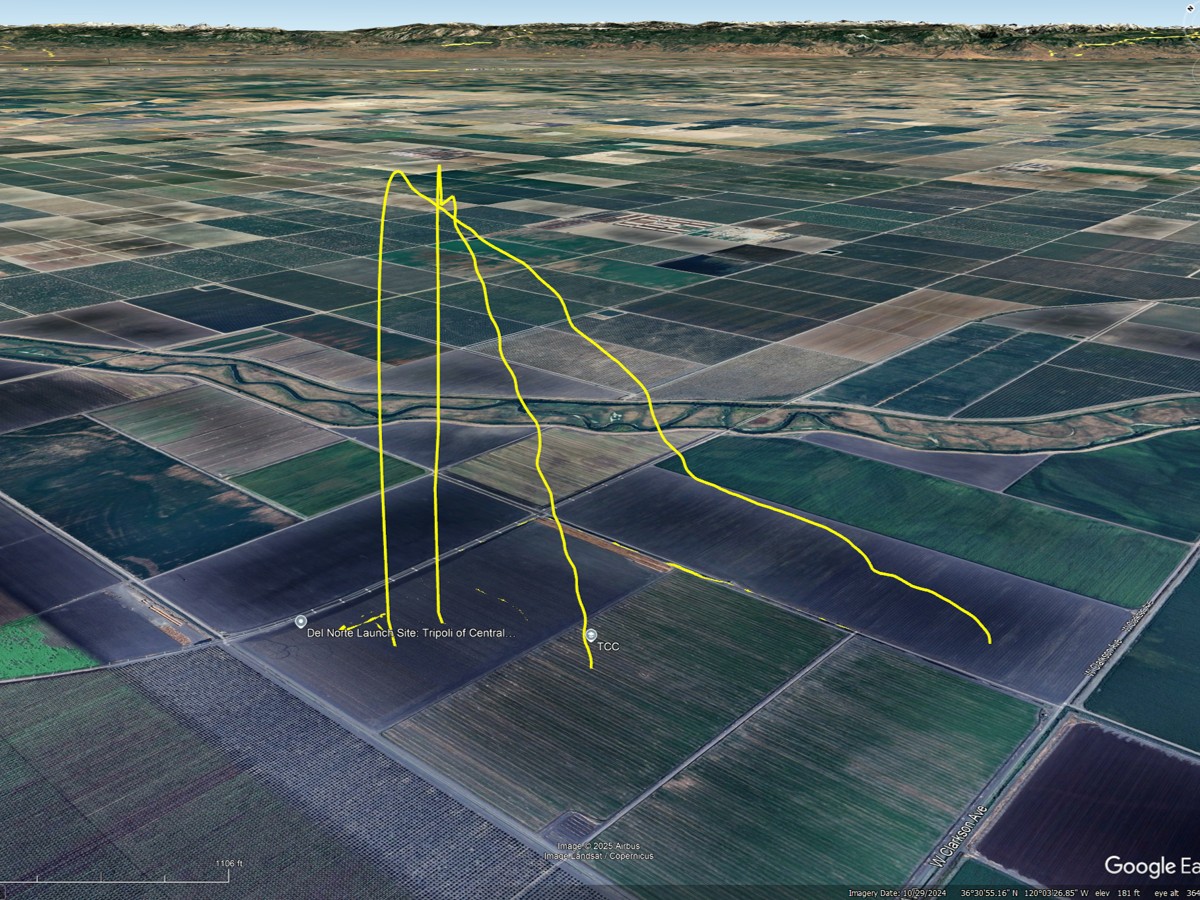
Flights 14 and 15 took place on May 15 and May 18 at LDRS at the TCC launch site in Helm, California. For flight 14, launched from the east bank of pads on the right, the winds were around 6 mph. For flight 15, launched from the west bank of pads on the left, the winds were around 15 mph at ground level, and 20 mph at higher altitudes. The two pads were 300 feet apart, and the two trajectories remained close to parallel up to the 2800 ft apogee despite the difference in wind velocities.
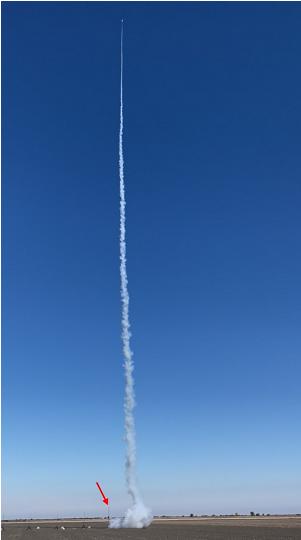
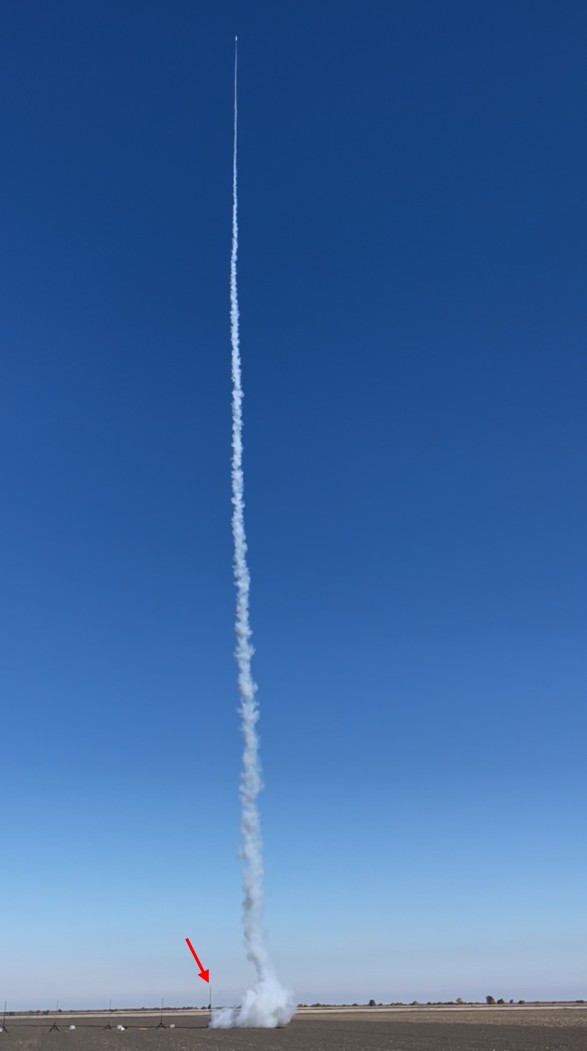
This is a picture of flight 13. The red arrow is pointing at the launch rail. The rocket is directly above the launch rail while the smoke has blown to the right away from the rail. The guidance system keeps the rocket pointed vertically, so it will eventually start to drift in the detection of the wind. To keep the rocket moving exatly straight up would require having the rocket pointed a little into the direction of the wind, which is not what the VOS control system does. The amount of drift at apogee for VTS-1 in a 10 mph wind is only about 200 feet for a flight to 2800 feet
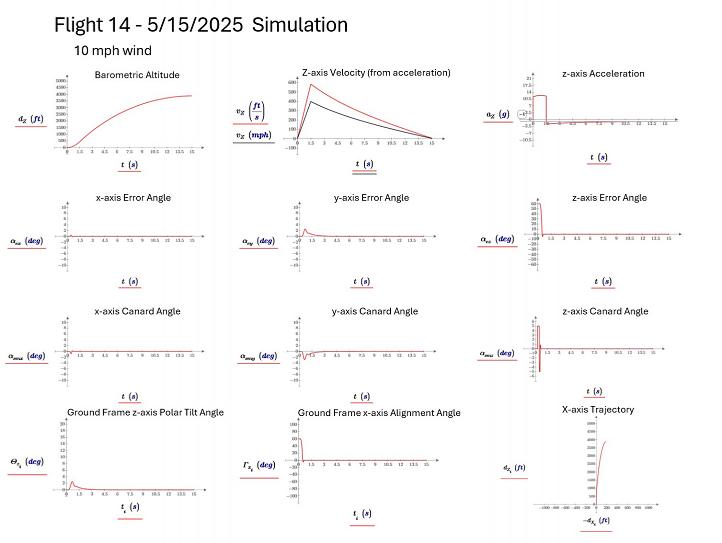
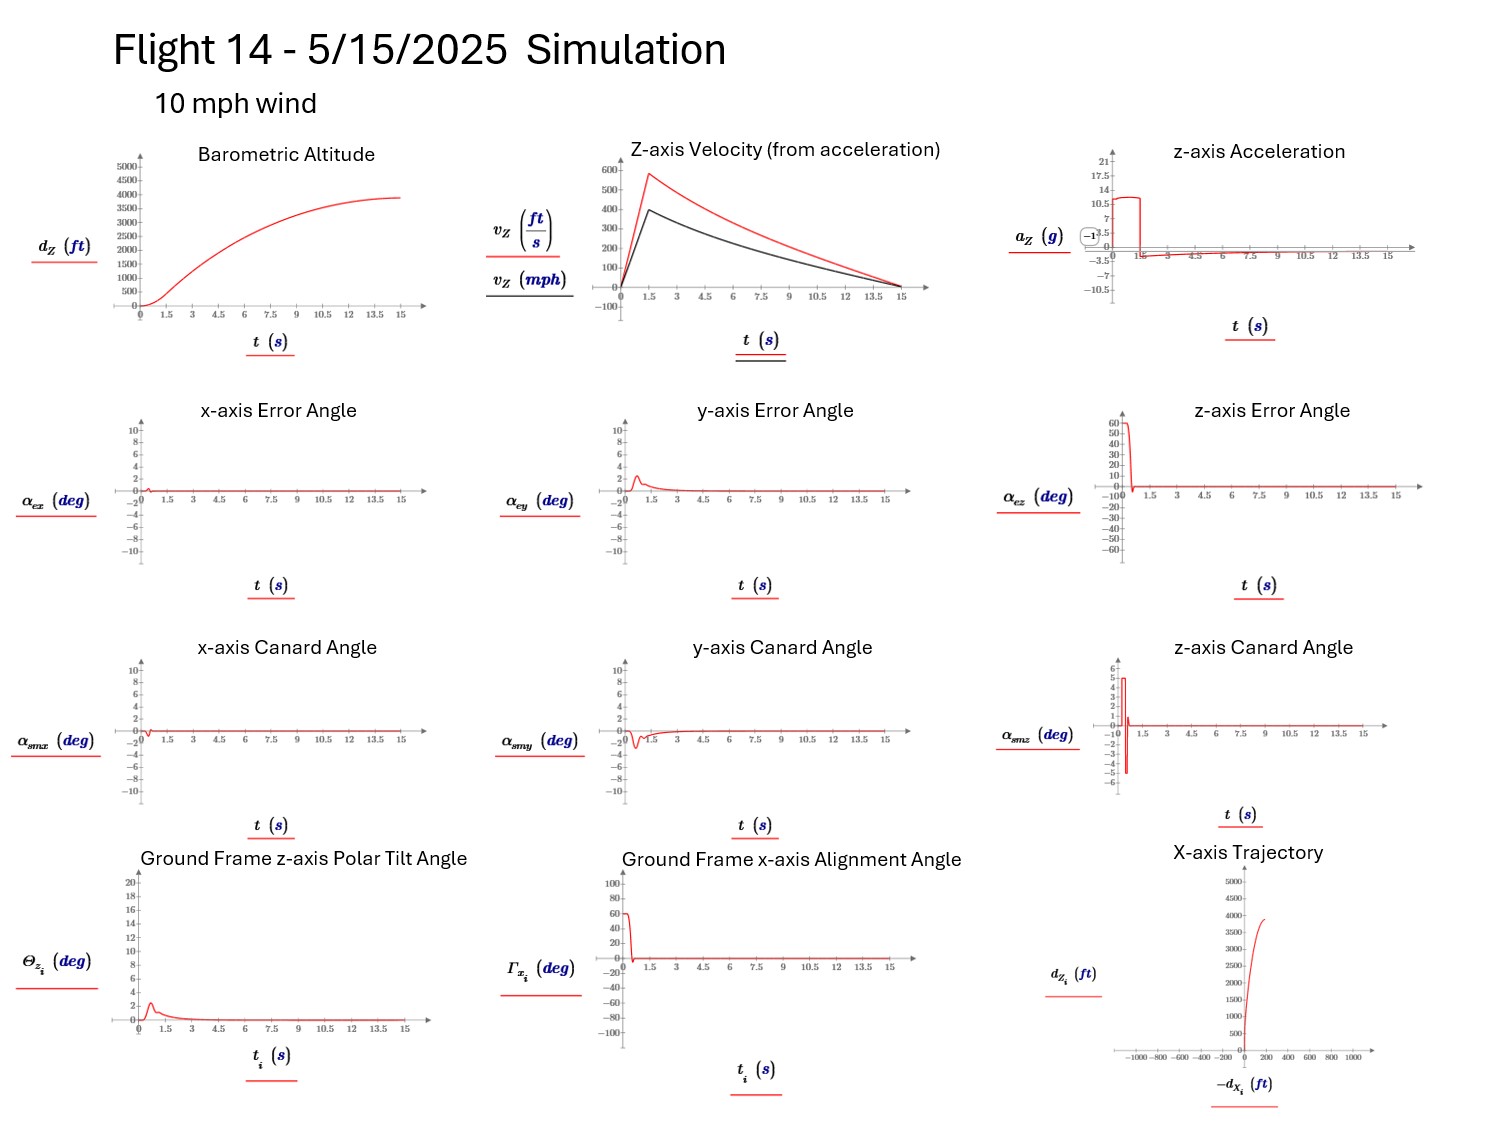
The following graphs (click to enlarge) are some of the outputs of the flight simulation for flight 14 of VTS-1 on an Aerotech J350-W in a 10 mph wind. For flight 14, the roll control is a state space type of controller with two states (two feedback paths). The feedback gains are calculated as a function of the velocity of the rocket to maintain the poles in a fixed location with a natural frequency of 5 Hz and a damping ratio of 0.707 for an "optimal" step response. The pitch and yaw controllers are also state space type controllers with two feedback paths, but the feedback gains are fixed. The pitch and yaw dynamics actually have 3 poles and 1 zero, meaning a 3 state controller is really needed for an optimized control system design. Doing the math for this and implementing a more optional controller is the next phase of the project.
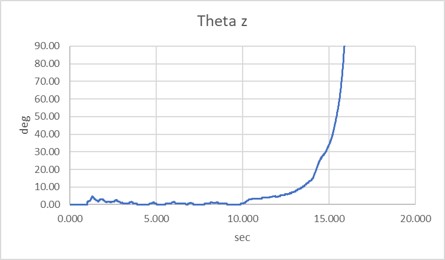
In the graphs below, the x and y-error angles are the angles between the rocket's x and y-axes and the projection of the vertical ground frame of reference Z-axis onto the rocket frame of reference via Euler's angels. The error angles are 0 when the rocket is pointing vertically The z-axis error is the angle between the x-axis of the rocket and due west in the ground frame of reference. This angle is zero when the rocket's x-axis is oriented west. These are the angles that are "fed back" in the control system for each of the three control loops.
For this simulation, the rocket starts out vertically on the launch rail, but is then hit with a 10 mph constant velocity lateral wind from the west (from the left on the X-axis trajectory graph) as it leaves the launch guide at 10 ft. The rocket starts with its x-axis +60 deg from due west, to the rocket executes a 60 degree rotation to align the x-axis due west as it leaves the launch rail.
The trajectory arcs to the east because the rocket is oriented vertically, and therefore accelerates horizontally with the wind (you have to point a little up stream to row straight across a river).
Click on the graphs to enlarge
Copyright © Thomas Fetter
2014-2026
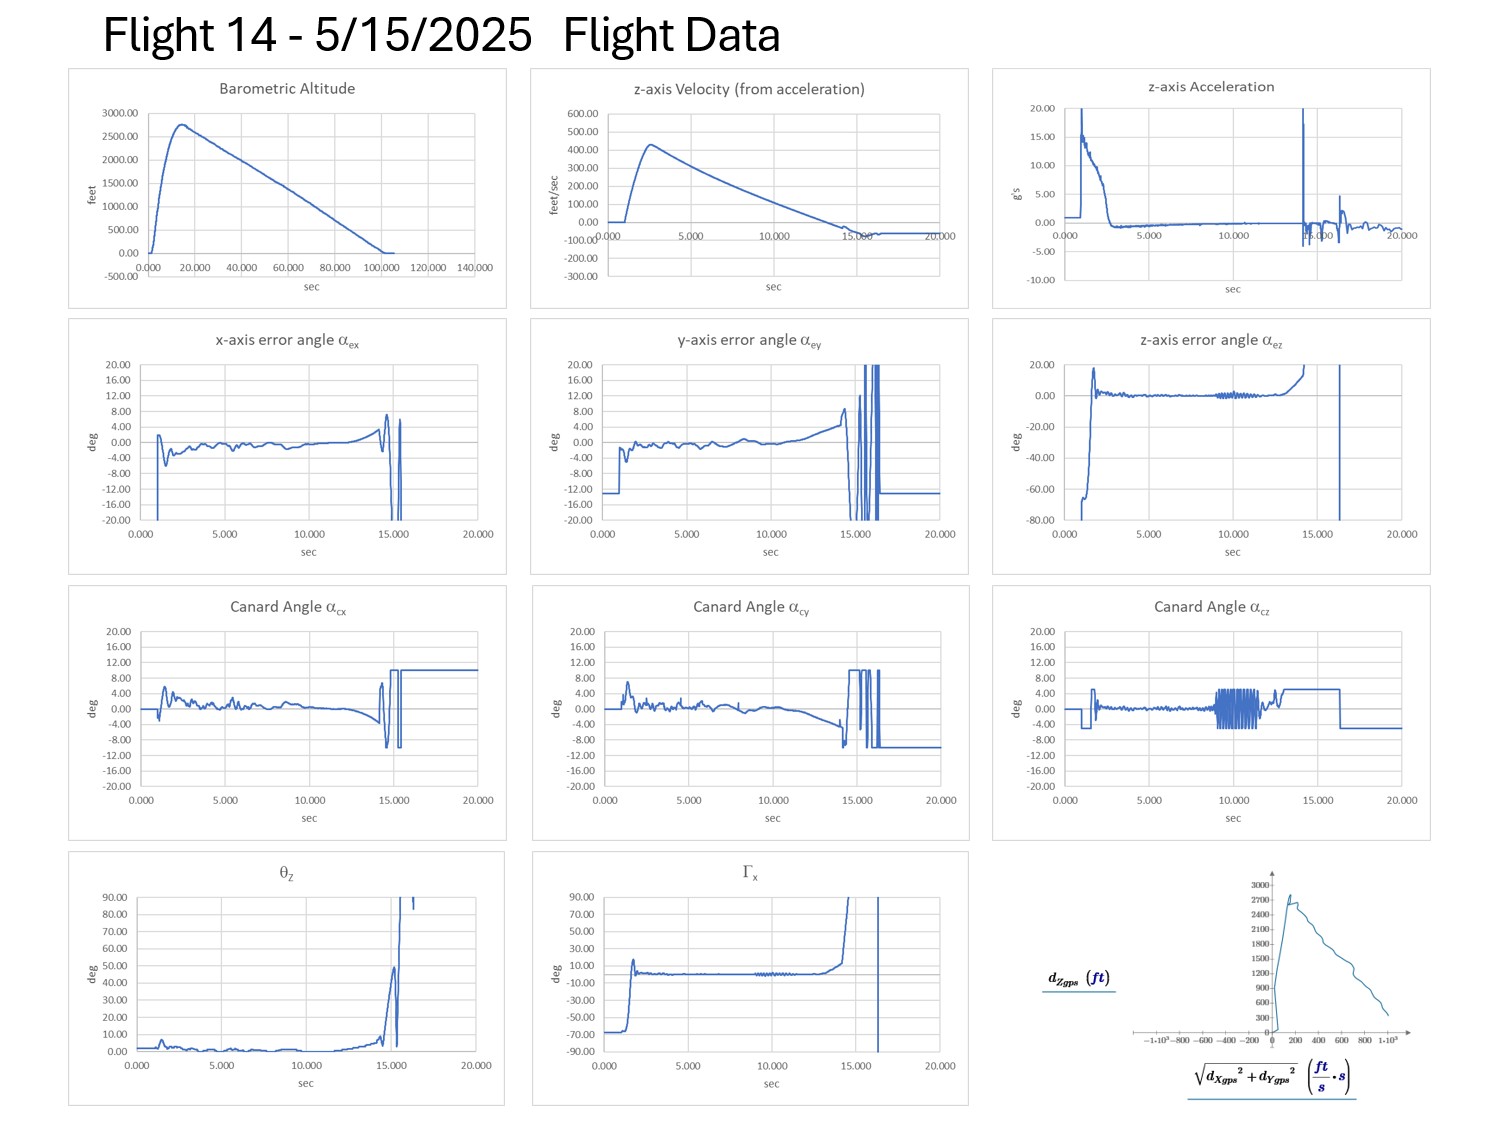
The following graphs are the actual flight data from flight 14. The initial orientation of the rocket's x-axis is -67 deg from due west rather than the +60 deg in the simulation. For these graphs, the launch begins at t = 1 sec.
Click on the graphs to enlarge.
Plotting tilt and z-axis rotation vs altitude shows that the VOS control system keeps the rocket orientated within 2 degrees tilt and rotation all the way to apogee once the system corrects for the initial step in wind and completes the x-axis alignment due west.
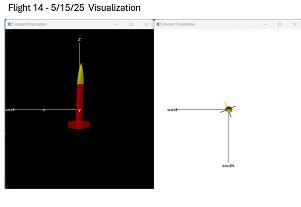
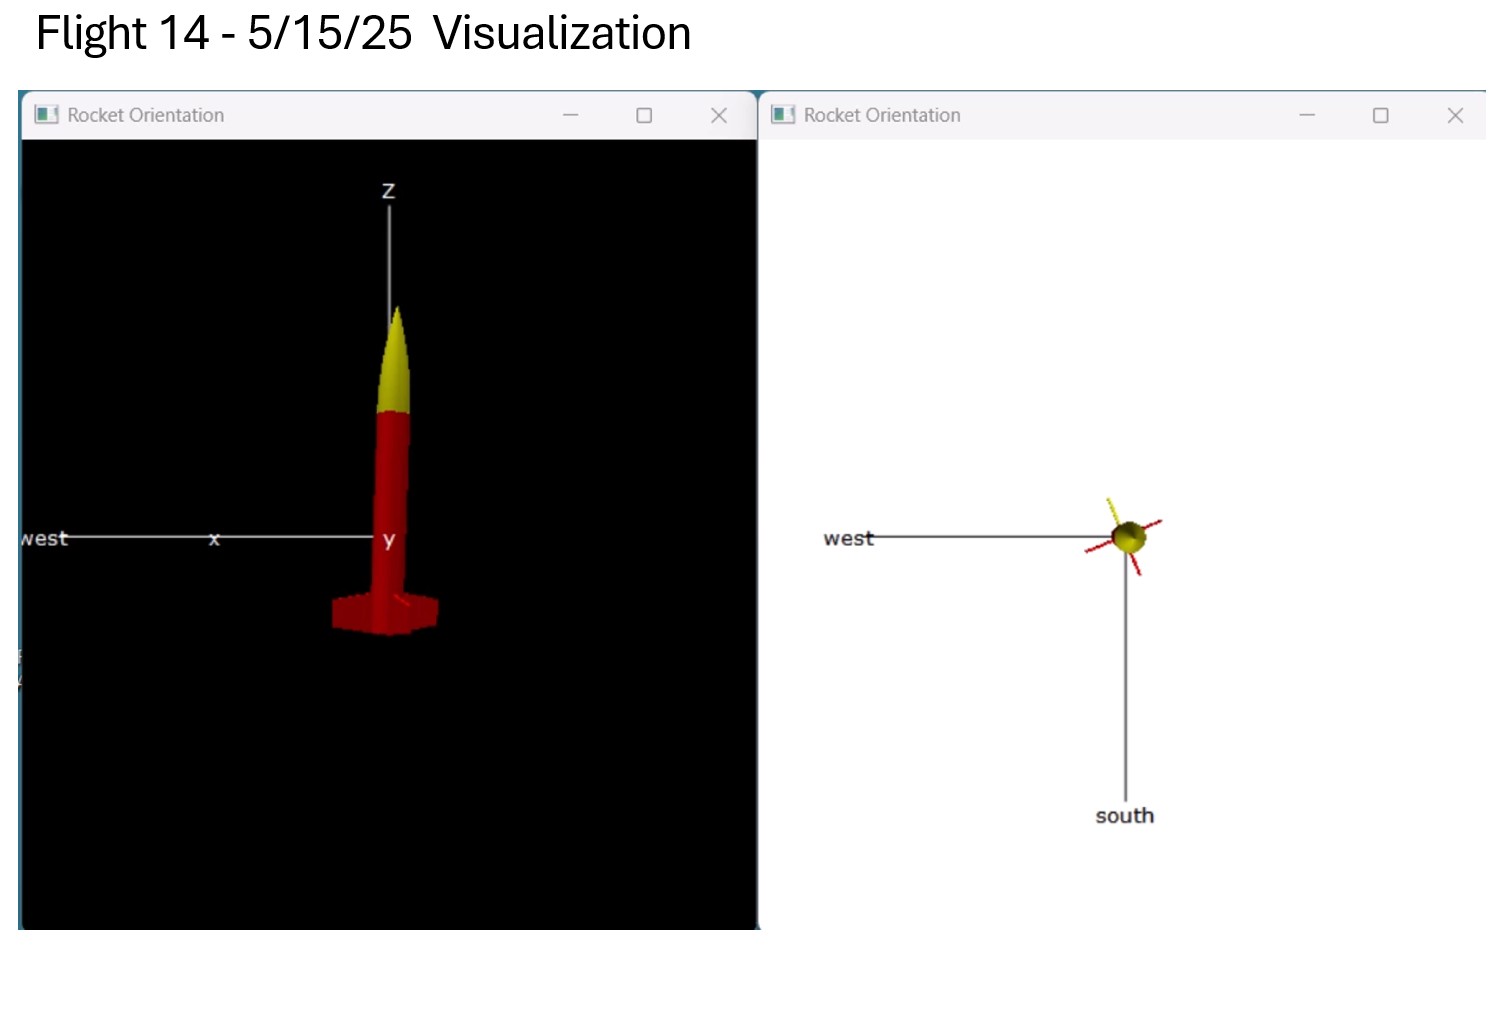
The Python flight visualization program can be used to show the orientation of the VTS-1 rocket during its flight in real time by playing back the flight data. The yellow fin indicates the positive x-axis of the rocket which the control system tries to align due west. Note that the rocket starting orientation is tilted slightly in an east- northeasterly direction due to the tilt of the launch rail, and that the x-axis (yellow fin) is -67 degrees from due west. As the rocket leaves the launch rail, it is subject to a step in wind velocity from the northwest, causing a brief tilt rotation in that direction, which is quickly corrected by the control system. At the same time, the rocket rotates 67 degrees about its z-axis to align the yellow fin due west. Once these two correction are made, the rocket holds roll, pitch,and yaw to within 2 degrees up to apogee. Click here to play the visualization video.
The results for flight 15 are very similar. Flight 15 added an integrator ahead of the state space control system for roll, making it a hybrid control system. A hybrid control system can reduce steady state errors that are inherently in a state space controller, but because there were no apparent sources of steady state errors, such a canard misalignment or off axis thrust from the motor, the hybrid controller performed no better than state space controller alone.
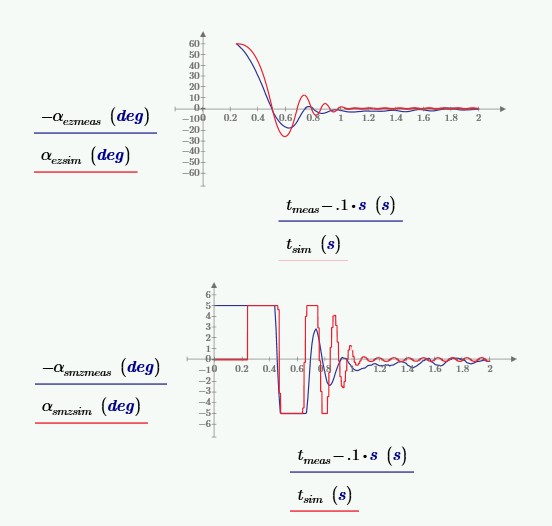
These graphs show how closely the measured flight data matches the flight simulation. The top graph is the roll error angle, and the bottom graph is the roll control angle of the canards. The measured system (blue trace) appears to have a little more damping than the simulation (red trace), but the rise time and natural frequency match very closely. The small sustained oscillation is a limit cycle oscillation cause primarily by the resolution of the angle sensor in the servo motor.